Packaging Line OEE Calculation: Formula & Example
A packaging line can appear busy throughout a shift while producing far fewer acceptable packages than expected. The filler is running, conveyors are moving, and operators are working—yet finished output still falls below the production target.
The missing output may come from equipment breakdowns, changeovers, reduced speeds, short interruptions, or rejected packages. Packaging line OEE calculation provides a consistent way to quantify those losses instead of treating them as one unexplained shortfall.
Quick answer: Overall Equipment Effectiveness (OEE) is calculated by multiplying Availability × Performance × Quality. For example, a packaging line with 83.33% availability, 86.67% performance, and 98% quality achieves approximately 70.78% OEE.
What Is OEE in a Packaging Line?
Overall Equipment Effectiveness measures how effectively a defined production process converts planned production time into first-pass good output at its specified ideal rate. Its three factors describe different types of loss:
- Availability: How much of planned production time was the line actually running?
- Performance: How quickly did the line operate compared with its ideal rate?
- Quality: How much finished output passed its requirements without rework?
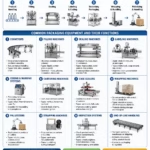
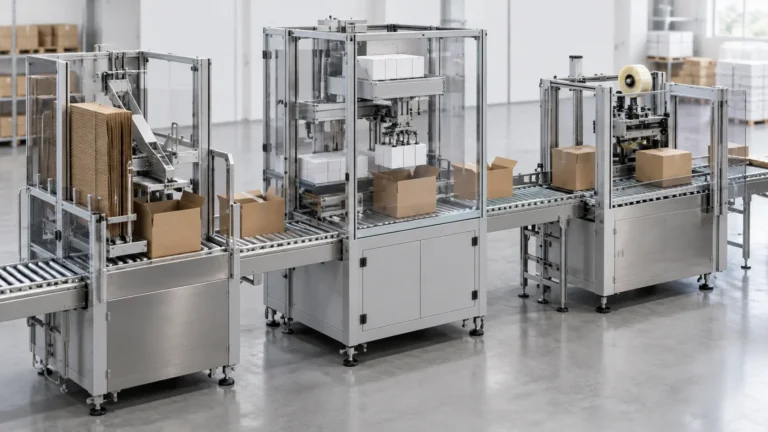
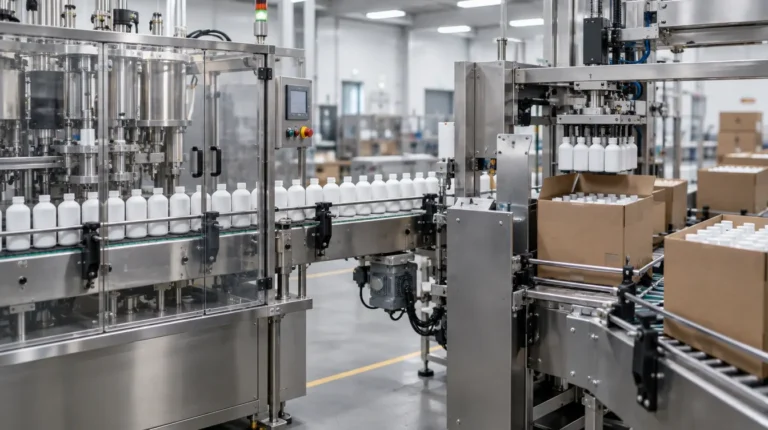
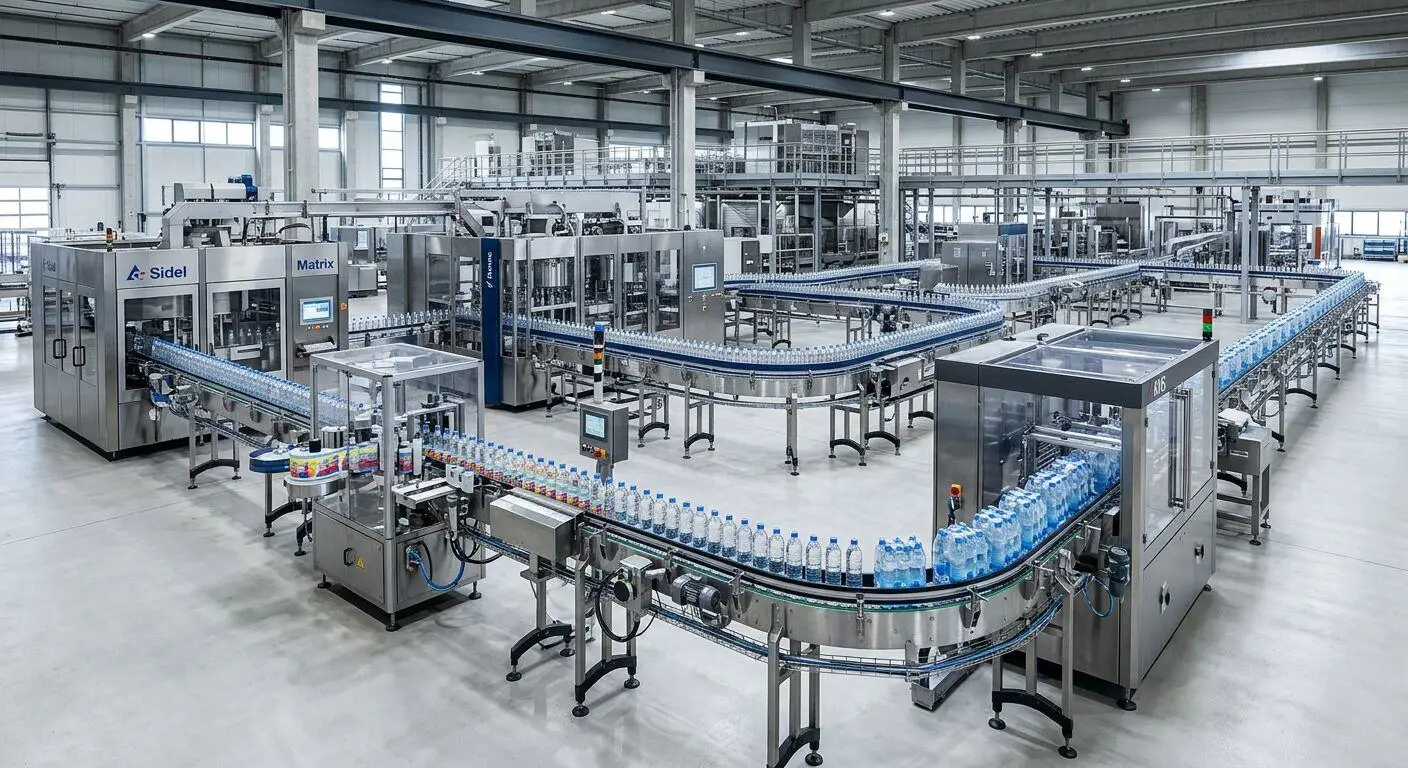
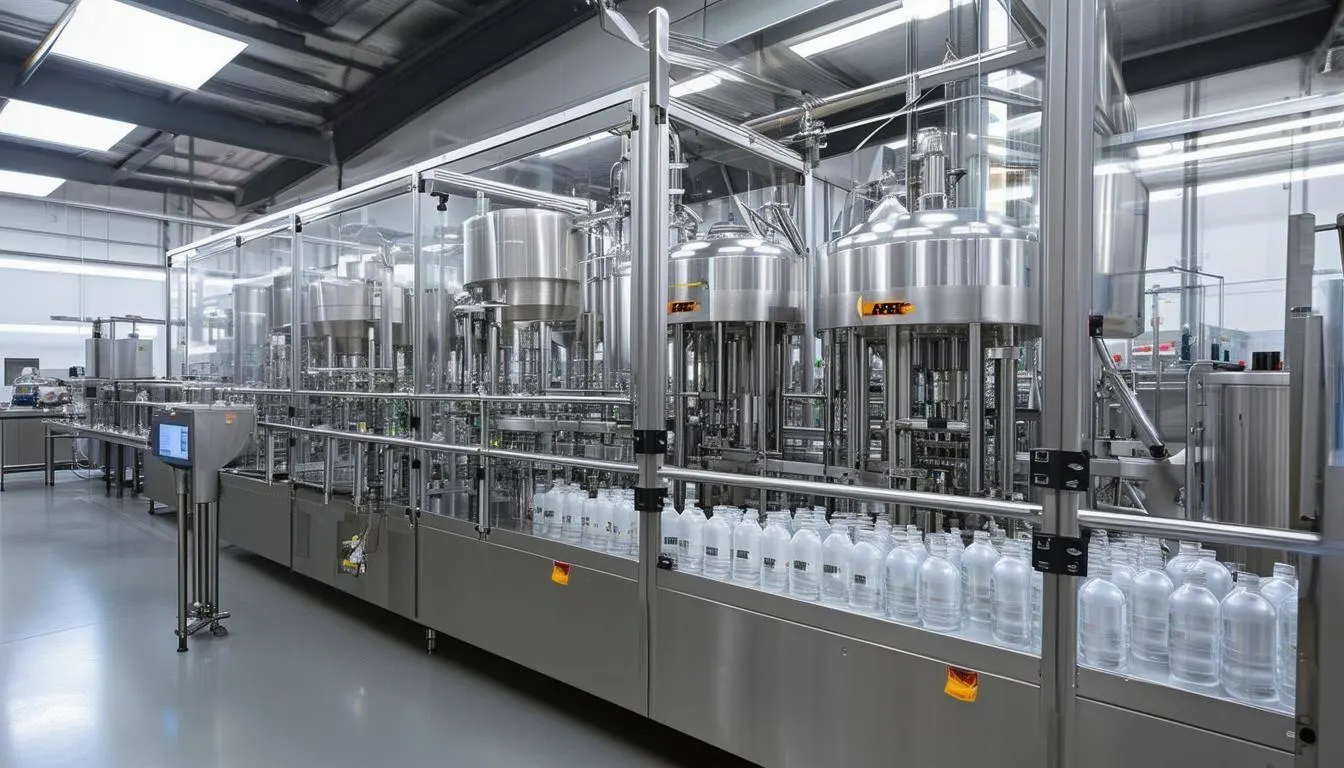
In a packaging plant, OEE can measure an individual filler, labeler, or case packer—or the performance of an integrated line. A typical bottle packaging line might connect bottle feeding, filling, capping, labeling, coding, inspection, and case packing.
These machines interact. A downstream case packer may block upstream production even when the filler is mechanically healthy. A slow labeler may restrict throughput even when other machines can run faster. For equipment context, see common packaging equipment in manufacturing.
Packaging Line OEE Calculation Formula
| Factor | Formula | What it reveals |
|---|---|---|
| Availability | Run Time ÷ Planned Production Time | Production time lost to stops |
| Performance | (Ideal Cycle Time × Total Count) ÷ Run Time | Small stops and reduced speed |
| Quality | Good Count ÷ Total Count | Rejected or reworked output |
| OEE | Availability × Performance × Quality | Overall productive effectiveness |
1. Calculate Availability
Availability is the share of planned production time when the measured process was running. Start by defining the time window and the stops that count against it.
Run Time = Planned Production Time − Stop Time
Availability = Run Time ÷ Planned Production Time
For example, an eight-hour shift is 480 minutes. If 30 minutes are scheduled breaks during which production was never intended, planned production time is 450 minutes. If breakdowns, changeovers, and other recorded line stops consume 75 minutes, run time is 375 minutes.
Changeovers and cleaning that occur during planned production generally count as Availability losses under the conventional OEE approach, even when their timing is anticipated. Excluding them simply because they are scheduled can overstate the result. The site should document its measurement rules and use them consistently.
2. Calculate Performance
Performance compares actual throughput with the output theoretically achievable during run time at a credible ideal speed.
The equivalent cycle-time calculation is Performance = (Ideal Cycle Time × Total Count) ÷ Run Time, with cycle time and run time in matching units.
If a line’s ideal speed is 60 bottles per minute, its theoretical output during 100 running minutes is 6,000 bottles. Producing 5,400 bottles gives a Performance factor of 90%. The remaining gap may reflect minor interruptions, misfeeds, short jams, or slower cycles.
The ideal rate should be the fastest credible, sustainable rate for the defined product and process under appropriate conditions—not merely a supervisor’s target. If measured Performance exceeds 100%, check the ideal-rate setting, counting boundary, and data quality.
3. Calculate Quality
Quality measures the share of output that met specifications on the first pass.
Quality = Good Count ÷ Total Count
Typical packaging rejects include incorrect fill levels, leaking seals, defective closures, incorrect labels, unreadable codes, and damaged packages. Packages requiring rework are not first-pass good units, even if they are later repaired.
When sealing failures contribute to rejects, see packaging equipment not sealing properly for common root causes.
Step-by-Step Packaging Line OEE Calculation Example
Consider a connected bottle filling, capping, labeling, and packing line. The following shift data is hypothetical and intended to illustrate the method.
| Production parameter | Value |
|---|---|
| Shift duration | 480 min |
| Excluded scheduled breaks | 30 min |
| Planned production time | 450 min |
| Recorded stop time | 75 min |
| Actual run time | 375 min |
| Ideal line rate | 60 bottles/min |
| Total bottles produced | 19,500 |
| Rejected bottles | 390 |
| First-pass good bottles | 19,110 |
Step 1: Availability
Step 2: Performance
Theoretical output during run time = 375 × 60 = 22,500 bottles.
Step 3: Quality
Good Count = 19,500 − 390 = 19,110 bottles.
Step 4: Overall OEE
70.78% equivalent good production time · 29.22% equivalent loss
Step 5: Check with the Direct Formula
For a single product format and consistent measurement boundary, the direct calculation gives the same answer:
19,110 ÷ (60 × 450) = 19,110 ÷ 27,000 = 70.78%
The line converted approximately 70.78% of its planned production time into acceptable finished bottles at its defined ideal production rate. This is not a mechanical efficiency rating for every individual machine.
Where Did the Lost Production Time Go?
At 60 bottles per minute, 450 planned production minutes represent a theoretical maximum of 27,000 bottles. The line produced 19,110 acceptable bottles. The shortfall—7,890 bottles—is equivalent to 131.5 minutes at the ideal speed.
| Component | Equivalent time | Interpretation |
|---|---|---|
| Good output | 318.5 min | 19,110 good bottles ÷ 60 |
| Availability loss | 75.0 min | Recorded line stops |
| Performance loss | 50.0 min | (22,500 − 19,500) ÷ 60 |
| Quality loss | 6.5 min | 390 rejected bottles ÷ 60 |
| Total | 450.0 min | Planned production period |
Availability losses are the largest category in this example, followed by Performance losses. That makes recorded downtime a sensible investigation priority. The final improvement decision should still consider root causes, correction costs, safety, and whether the changes will be sustainable.
Packaging Line OEE vs. Individual Machine OEE
Machine OEE and line OEE are not interchangeable. The scope, output counting point, downtime definition, and ideal speed must match the process being measured.
| Dimension | Machine OEE | Line OEE |
|---|---|---|
| Scope | One filler, capper, or labeler | Defined integrated line |
| Output | Machine-specific units | Good output at chosen line boundary |
| Ideal speed | Machine’s ideal rate | Ideal rate for the measured line |
| Typical losses | Local machine failures | Blocking, starvation, shared stops, constraints |
| Purpose | Equipment diagnosis | Whole-process effectiveness |
If a filler reports 90% OEE and a labeler reports 80% OEE, neither their average (85%) nor their product (72%) automatically represents the packaging line’s OEE. A line-level result must come from valid line-level measurements.
Define the Measurement Boundary
Before collecting data, identify the first and last operations included—for example, bottle feeding through case packing—and where acceptable output is counted. If you count cases, express both actual output and the ideal rate in cases. Never mix bottle counts with case counts in one formula.
Identify the Constraint
The sustained throughput of a connected line depends on its effective bottleneck. A filler rated at 100 bottles per minute cannot make the complete line deliver that rate if the downstream process is limited to 70 bottles per minute. Confirm actual line capability for each package format, rather than using the fastest individual machine’s nameplate rate.
Conveyor design and accumulation also matter. Learn how buffers and transfers affect production flow in the packaging conveyor system guide.
Common OEE Losses in Packaging Operations
OEE losses are frequently grouped into six practical categories. Two primarily affect Availability, two affect Performance, and two affect Quality.
| Loss type | Factor | Packaging example |
|---|---|---|
| Equipment failures | Availability | Capper drive failure |
| Setup and adjustment | Availability | Bottle-size changeover |
| Minor stops | Performance | Short label misfeeds |
| Reduced speed | Performance | Running below the ideal rate |
| Startup rejects | Quality | Unacceptable packages during startup |
| Production rejects | Quality | Incorrect fill or failed seals |
Starvation and Blocking
Starvation occurs when a machine lacks product or material from upstream. Blocking occurs when it cannot discharge products because downstream equipment or accumulation space is unavailable. The stopped machine may not be the source of the fault; record both the affected equipment and the initiating cause.
Changeover Losses
Changes in container size, film, label, closure, or product can require tooling changes, cleaning, recipe setup, and verification. Track changeover duration separately from unexpected failures, while accounting for it consistently in the planned-production window.
Rejects and First-Pass Quality
Keep the original defect reason, equipment location, and product format for each reject when practical. Combining underfilled bottles, unreadable codes, and poor seals into one generic rejection count makes action harder, even when the Quality percentage is mathematically correct.
OEE Calculation for Multiple Products and Package Sizes
Mixed-format production requires special care. A line may have a different ideal rate for 250 mL bottles than for 1 L bottles, pouches, or cartons. One average ideal rate can distort Performance.
Record planned time, runtime, total output, good output, and the appropriate ideal cycle time for each product format. When all output counts have compatible definitions, a time-equivalent method can aggregate mixed production runs:
For example, if cycle times are expressed in minutes per package, the numerator is a sum of fully productive equivalent minutes. The denominator must cover the same shift boundary, including applicable changeover losses. Do not add an individual run’s percentage values together or average them without an appropriate weighting method.
How to Calculate Packaging Line OEE in Excel
A simple Excel worksheet works well for an initial study if production counts and downtime observations are trustworthy. Enter the following sample values and formulas in column B:
| Cell | Parameter | Value / Excel formula |
|---|---|---|
| B2 | Shift duration (min) | 480 |
| B3 | Excluded breaks (min) | 30 |
| B4 | Recorded stop time (min) | 75 |
| B5 | Ideal rate (units/min) | 60 |
| B6 | Total count | 19500 |
| B7 | Reject count | 390 |
| B8 | Planned production time | =B2-B3 |
| B9 | Run time | =B8-B4 |
| B10 | Good count | =B6-B7 |
| B11 | Availability | =B9/B8 |
| B12 | Performance | =B6/(B9*B5) |
| B13 | Quality | =B10/B6 |
| B14 | OEE | =B11*B12*B13 |
Format B11 through B14 as percentages. For the example above, B14 displays approximately 70.78%. A production-ready worksheet should also check for zero denominators, negative inputs, inconsistent counts, and mismatched product formats.
What Is a Good OEE for a Packaging Line?
An OEE value of 85% is widely cited as an aspirational reference point, but it is not a universal threshold for packaging operations. Short-run production with frequent legitimate changeovers should not be judged as though it were a continuous, single-format line.
A more useful assessment considers the same product or product family over comparable shifts, the underlying Availability/Performance/Quality trends, and whether improvements are achieved without compromising safety or finished-package quality.
For related manufacturing terminology, see packaging machine terms explained.
How to Improve Packaging Line OEE
1. Prioritize the Largest Verified Downtime Losses
Log both duration and reason for significant interruptions. A Pareto chart can identify whether most lost time comes from a small set of recurring problems such as jams, sensor faults, utility interruptions, or missing packaging materials. For diagnostic context, see why packaging machines stop working.
2. Reduce Changeover Time
Document each setup step. Prepare materials and tooling in advance where safe, standardize mechanical settings, and verify product recipes. Compare similar changeovers to identify avoidable variation.
3. Strengthen Preventive Maintenance
Compare recurrent fault codes with the maintenance history. Address recurring wear, alignment problems, and sensor contamination based on manufacturer instructions and the actual duty cycle. A packaging machine maintenance checklist can help structure inspections.
4. Improve the True Bottleneck
Speeding up a non-bottleneck machine may increase accumulation or blocking without producing more finished packages. Identify the line constraint before raising machine speeds or buying new equipment. This also matters when choosing a filling machine for an integrated line.
5. Reduce Quality Rejects
Segment rejects by defect, product, time, and equipment. Confirm whether root causes involve materials, process settings, mechanical wear, or inspection requirements. Maintain validated acceptance criteria rather than improving the OEE score by relaxing quality checks.
6. Track Trends, Not Just One Score
Review OEE by shift and product, while keeping the three component measures visible. A higher score is more meaningful when the team can explain which underlying losses changed. PMMI’s 2026 OEE survey also identifies downtime tracking, operational visibility, and root-cause analytics as important areas for packaging and processing equipment monitoring.
Common Packaging Line OEE Calculation Mistakes
| Mistake | Consequence | Better approach |
|---|---|---|
| Excluding all planned stops | Availability appears too high | Define the planned-production boundary |
| Using an arbitrary ideal speed | Performance becomes misleading | Validate the ideal rate for each format |
| Averaging machine OEE scores | Not a true line-level KPI | Measure the defined process output |
| Counting reworked units as first-pass good | Quality is inflated | Separate first-pass and reworked output |
| Mixing bottles and cases | Invalid ratios | Use consistent output units |
| Ignoring short stops | Performance losses are hidden | Use consistent interruption rules |
| Combining formats with one speed | Distorted shift OEE | Use format-specific ideal cycle times |
| Reporting only the OEE percentage | Little root-cause insight | Display A, P, Q and loss reasons |
Frequently Asked Questions
How do you calculate OEE for a packaging line?
Calculate Availability as Run Time divided by Planned Production Time, Performance as actual output divided by ideal output during run time, and Quality as first-pass good output divided by total output. Multiply the three decimal ratios.
What data is required for packaging line OEE calculation?
You need planned production time, stop time, ideal rate or ideal cycle time, total produced count, and first-pass good count. Recording downtime reasons, reject categories, and product formats makes the results actionable.
What is the difference between OEE and production efficiency?
OEE explicitly combines time availability, ideal-speed performance, and first-pass quality. Production efficiency may refer to an output-to-input ratio or another plant-specific KPI, so the definitions must be stated before comparing values.
Should packaging changeover time be included in OEE?
In a conventional OEE calculation, changeovers occurring during planned production time count as Availability losses. Document exclusions and apply the same logic across periods and lines.
Can a packaging line have a different OEE from its individual machines?
Yes. Measurement scope, ideal rate, time boundary, and output counting point may differ. Individual machine scores should not simply be averaged or multiplied to estimate line OEE.
How often should OEE be calculated?
OEE can be reviewed by production run, shift, day, or a longer period. Shift-level monitoring is a useful starting point, and shorter intervals can help diagnose recurring stops when trustworthy data is available.
Is OEE the same as line utilization?
No. OEE evaluates effectiveness during planned production time. Utilization addresses how much of the broader available time is scheduled or used. TEEP is a related measure that incorporates utilization relative to all available calendar time.
Final Thoughts
Packaging line OEE calculation translates production records into a clear account of lost capacity. The most useful result is not a percentage alone: it is a consistent distinction between stop time, reduced-speed losses, and first-pass quality losses.
For an integrated line, establish a defensible production boundary, define the ideal rate for each format, record blocking and starvation causes, and investigate the largest recurring losses. The goal is to produce more acceptable packages safely and consistently—not simply to make the reported OEE number look better.
References and Further Reading
- Vorne Industries. OEE Calculation: Definitions, Formulas, and Examples.
- Vorne Industries. OEE Factors: Availability, Performance, and Quality.
- Packaging World. How to Calculate Overall Equipment Effectiveness: A Practical Guide.
- PMMI. Overall Equipment Effectiveness Quickie Survey 2026.